
Introduction to the Pie Chart Component in SwiftUI
The Pie Chart component for SwiftUI offers a visually appealing and efficient way to display categorical data distributions. Designed with ease of use and customization in mind, this component seamlessly integrates with SwiftUI’s declarative syntax, allowing developers to quickly create and modify pie charts in their apps.
Key Features:
- Simple Integration: The Pie Chart component can be easily added to any SwiftUI view with minimal code.
- Customizable Appearance: Adjust colors, segment sizes, labels, and animations to suit your app’s design.
- Data-Driven: Automatically updates based on your data model, offering real-time feedback as data changes.
- Interactive Features: Add gestures like taps or swipes for more interactive charts, perfect for data exploration.
Whether you're building a dashboard, a stats page, or simply want to visualize data, the Pie Chart component in SwiftUI makes it easy to enhance your app with beautiful and functional charts.
![Line Chart with SwiftUI [Chart Framework]](assets/176.jpg)
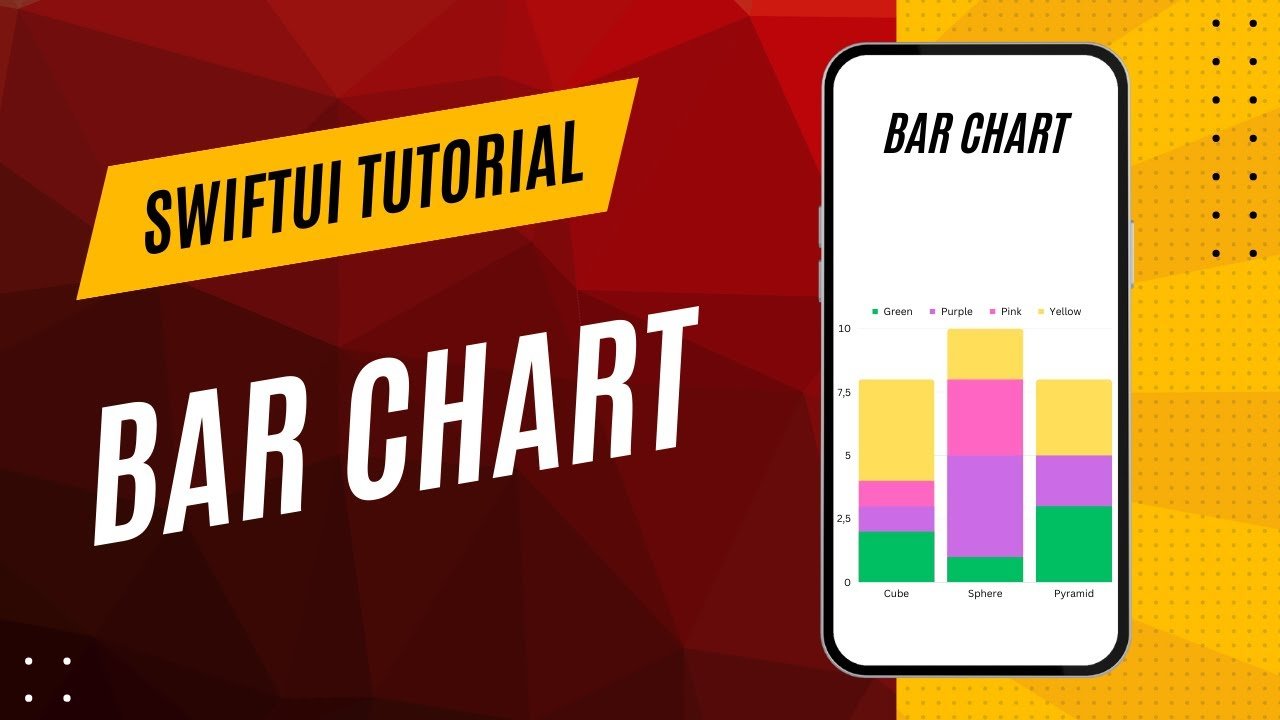
![Bar Chart with SwiftUI [Chart Framework]](assets/179.jpg)
![Scatter Chart with SwiftUI [Chart Framework]](assets/181.jpg)
![Donut Chart with SwiftUI [Chart Framework]](assets/184.jpg)